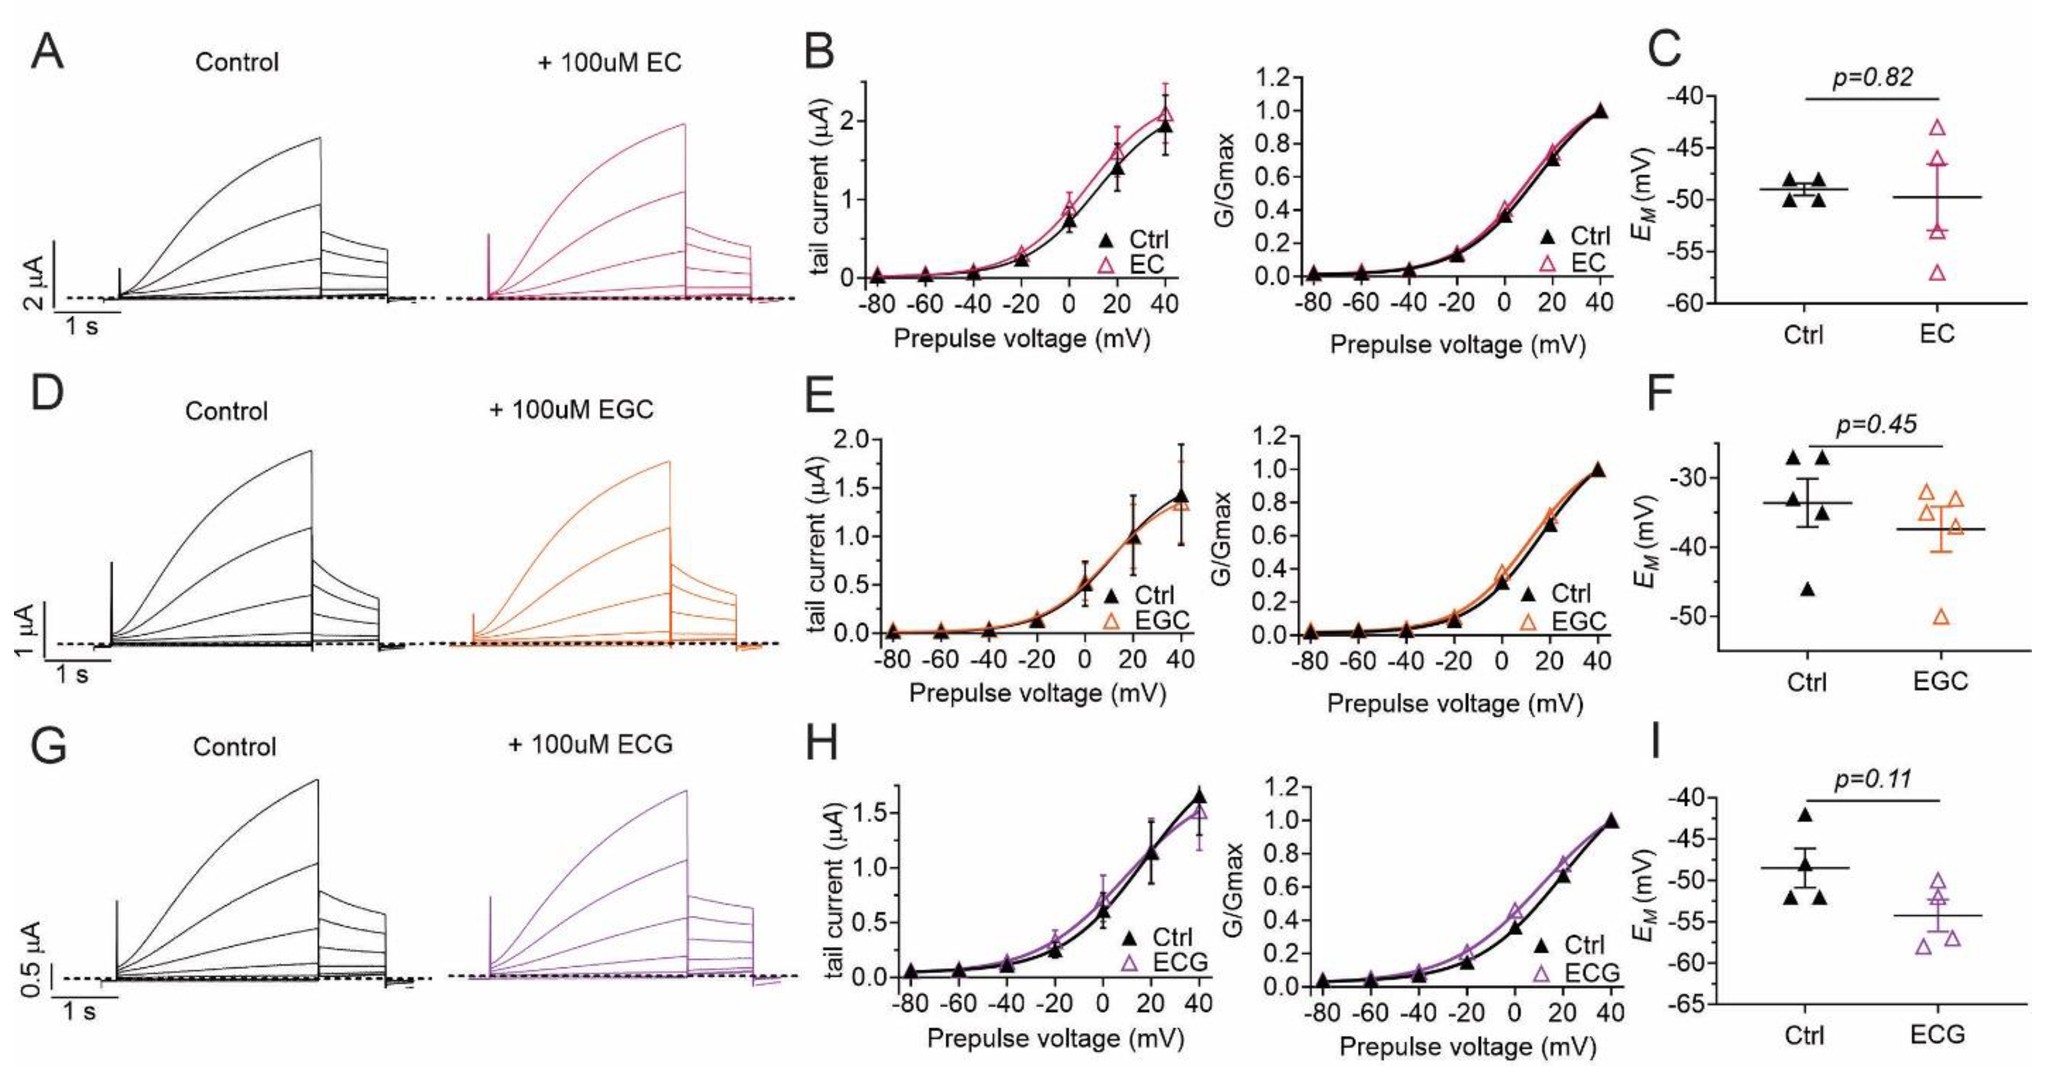
Fig. 5. EC, EGC and ECG have negligible effects on KCNQ1/E1 channels. All error bars indicate SEM. A: Mean KCNQ1/E1 traces in the absence (Control) and presence of 100 µM EC (n = 4). B: Left, mean tail current; right, mean normalized tail current (G/Gmax) verses prepulse voltage for traces as in A (n = 4). C: Scatter plot of unclamped membrane potential (EM) for cells as in A (n = 4). Statistical analyses by two-way ANOVA. D: Mean KCNQ1/E1 traces in the absence and presence of 100 µM EGC (n = 5). E: Left, mean tail current; right, mean normalized tail current (G/Gmax) verses prepulse voltage for traces as in D (n = 5). F: Scatter plot of unclamped membrane potential (EM) for cells as in D (n = 5). Statistical analyses by two-way ANOVA. G: Mean KCNQ1/E1 traces in the absence and presence of 100 µM ECG (n = 4). H: Left, mean tail current; right, mean normalized tail current (G/Gmax) verses prepulse voltage for traces as in G (n = 4). I: Scatter plot of unclamped membrane potential (EM) for cells as in G (n = 4). Statistical analyses by two-way ANOVA.